![[McMaster Crest]](regcrest.gif) QSEP
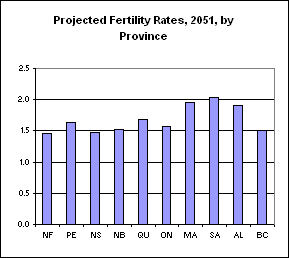
QSEP - fertility rates in all provinces and territories remain at their 2007 levels; the Canada total fertility rate in 2005 was 1,659 births per 1000 women
- mortality rates continue to fall, but less rapidly than they have; by 2026 the assumed annual rate of decline in each age group is 80 percent as great as during the period 1971-2001
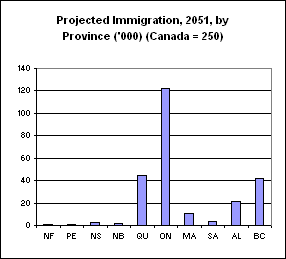
- immigration to Canada is set at 250,000 per year, a little over the 2004-2008 average of 246,000; the provincial shares are set at their 2004-2008 averages
- emigration from all provinces and terrritories is related to the previous year's population; for Canada the average for 2004-2008 was 0.12 percent
- interprovincial migration for all provinces and territories adjusts such that, by 2016, inflows are equal to outflows; by that year both are assumed equal to half the 2004-2008 average of inflows plus outflows
- all projections are based on the use of MEDS
- same as standard case except that immigration is set to zero after 2010
- same as standard case except that fertility rates in each province increase linearly to 2.1 by 2016